
TL;DR
- The benchmark: marketing budgets average 7.8% of company revenue in 2026, according to Gartner’s survey of large companies, and the US Small Business Administration suggests 7 to 8% for small businesses.
- The caveat: benchmarks vary widely by business model and market, and most come from the US, where a small business means under $5 million in revenue.
- The measurement gap: 85% of marketers say they are confident measuring ROI, but only 32% evaluate their channels together, according to Nielsen.
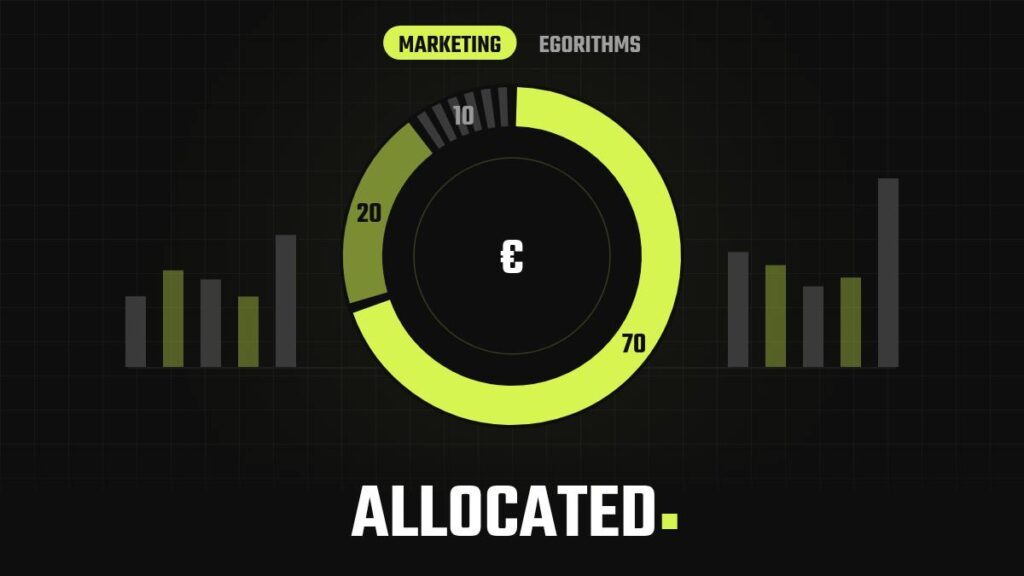
- Common allocation models: a share of revenue checked bottom-up, a customer acquisition cost limit based on lifetime value, the 70/20/10 rule and the brand-to-activation balance.
- What changes in 2027: AI takes a growing share of budgets, ad platforms automate creative and targeting, and AI search makes brand and product data part of performance.
Contents
- Marketing budget benchmarks
- Why averages mislead
- The measurement gap
- Four allocation models
- Metrics that shape the budget
- What small budgets can do
- Common budgeting mistakes
- What changes in 2027
- FAQ
- Vyara’s take
Every year, business owners ask how much they should spend on marketing, and every year the answer starts with an average. The averages are real, but they describe specific markets, company sizes and business models. Used without context, they can lead to budgets that are either unrealistic or impossible to evaluate.
Marketing budget benchmarks
| Source | Benchmark | Context |
|---|---|---|
| Gartner CMO Spend Survey 2026 | 7.8% of company revenue, up from 7.7% in 2025 | 401 marketing leaders, mostly at companies with over $1 billion in revenue |
| US Small Business Administration | 7 to 8% of gross revenue | Businesses under $5 million in sales with a 10 to 12% net margin |
| The CMO Survey, by business model | From about 8% for B2B products to about 15% for consumer services | Wide differences between models and industries |
Gartner also found that 56% of marketing leaders consider their 2026 budget insufficient for their strategy, and that CMOs allocate an average of 15.3% of marketing budgets to AI.
Why averages mislead
- Different definitions of size. In the US, a small business can have up to $5 million in revenue. In many smaller European markets, a company of that size considers itself medium or large.
- Different business models. Consumer services typically spend a much larger share of revenue on marketing than B2B product companies.
- Different stages. A startup buying information through tests and an established brand defending market share need very different budgets.
- No link to results. A percentage says nothing about which channels work or what a customer costs.
The measurement gap
| Finding | Source |
|---|---|
| 85% of marketers are confident in measuring total marketing ROI | Nielsen, 2025 |
| Only 32% evaluate traditional and digital media holistically | Nielsen, 2025 |
A budget for the next year depends on knowing what the current one delivered. Practitioners usually recommend four sources: the CRM or order system, web analytics and Search Console, ad platform reports, and asking customers directly how they heard about the business. The last one captures referrals and AI recommendations that software often cannot attribute.
Four allocation models
| Model | How it works | Limitation |
|---|---|---|
| Share of revenue, checked bottom-up | A percentage of revenue as a starting point, compared with the number of new customers needed and the cost of acquiring each | Large gaps between the two figures signal unrealistic goals or budgets |
| Acquisition cost limit | Maximum cost per customer = lifetime value × gross margin ÷ 3, based on the common 3:1 LTV to CAC guideline | A rule of thumb, not a law |
| 70/20/10 | 70% to proven channels, 20% to growing channels, 10% to experiments | A practical heuristic, not a research finding; startups usually test more |
| Brand and activation | Binet and Field’s research suggests about 60% brand building and 40% short-term activation for consumer brands; for B2B, the LinkedIn B2B Institute puts the balance at about 46% brand and 54% activation | Optimal splits vary by category, price and growth stage |
Metrics that shape the budget
| Metric | Why it matters |
|---|---|
| Customer acquisition cost by channel | Shows where customers cost least |
| Source of retained customers | Shows which channels bring loyal customers |
| Payback period | Shows how long cash is tied up |
| Marketing efficiency ratio | Revenue relative to total marketing spend, across all channels |
| Repeat purchase rate | Guides spending on retention versus acquisition |
| AI assistant traffic and revenue | Measures a growing discovery channel |
| AI brand mentions | Shows whether AI assistants include the brand in answers |
| Branded search volume | Indicates whether brand investment builds recognition |
What small budgets can do
| Monthly budget | Illustrative math | Practical use |
|---|---|---|
| €100 | About €3.30 a day; at €0.50 per click and a 2% conversion rate, about 200 visits and 4 sales | Remarketing, branded search ads, local campaigns, boosting proven posts |
| €1,000 | Enough to test, unless split across many platforms and campaigns | One platform and one objective first, then expand based on results |
Ad algorithms learn from conversions. Meta’s learning phase typically requires about 50 optimization events within seven days, which very small budgets rarely reach. Search ads capture existing demand, while social ads create demand among people who were not searching.
Common budgeting mistakes
| Mistake | Consequence |
|---|---|
| No remarketing budget | Paid visitors leave without a second touchpoint |
| Spending without measurement | No link between campaigns and sales |
| Targeting everyone | Messages fit no specific customer group |
| Dependence on one platform | No alternative if costs rise |
| Relying on platform attribution | Several platforms claim the same sale |
| Ignoring existing customers | Retention, usually cheaper than acquisition, gets little budget |
| Cutting brand and content | Less information for AI assistants to cite |
| Setting the budget once a year | No adjustment to performance during the year |
What changes in 2027
| Trend | Implication |
|---|---|
| AI in marketing budgets | CMOs already allocate an average of 15.3% of marketing budgets to AI, according to Gartner |
| Ads inside AI assistants | ChatGPT ads became available to advertisers in 31 European markets in August 2026 |
| Automated ad creation | Meta aims to fully automate ad creation and targeting with AI, according to a 2025 Wall Street Journal report |
| AI search and shopping | Brand mentions, product data and reviews influence whether AI assistants recommend a business |
| Measurement of AI channels | AI-assisted traffic, citations and sales need dedicated tracking |
FAQ
What percentage of revenue should go to marketing?
Benchmarks range from about 7 to 8% for small businesses and large companies on average, up to around 15% for some consumer service businesses. The right figure depends on the business model, margins, growth goals and what each channel returns.
What is the 70/20/10 rule in marketing?
A heuristic that allocates 70% of the budget to proven channels, 20% to promising ones and 10% to experiments. It is a practical guideline rather than a research finding.
How much can a business pay to acquire a customer?
A common guideline is that customer lifetime value should be about three times the acquisition cost. Multiplying lifetime value by gross margin and dividing by three gives a rough upper limit.
How should budgets be split between brand and sales?
Research by Les Binet and Peter Field suggests about 60% brand building and 40% activation for consumer brands, with a smaller brand share in B2B.
Is €100 a month enough for ads?
It can be, for focused uses such as remarketing or branded search ads. It is usually too little for broad campaigns, because ad algorithms need enough conversions to optimize.
Why should AI visibility be part of a marketing budget?
AI assistants increasingly influence which brands customers consider. Tracking AI mentions and AI-assisted traffic helps businesses decide how much to invest in content, product data and digital PR.
Vyara’s take
“The question isn’t whether to spend €100 or €1,000. Both can be enough and both can be too little. The real question is what each euro has to bring back, and whether you can measure it. The businesses that will plan 2027 well aren’t the ones with the biggest budgets, but the ones that know where their money came from in 2026.”
Further reading: How Much Should You Spend on Marketing in 2027? – Vyara Stefcheva’s practical guide on stefcheva.com.
Sources: Gartner CMO Spend Survey 2026 · MediaPost on Nielsen ROI research · LinkedIn B2B Institute report · OpenAI on ChatGPT ads in Europe · Jon Loomer on the learning phase
About the Author

👉Want guest posting?🪙Subscribe to the @egorithms Telegram